Pricing and quality look-up tool for virtually any health system
With valuable data at both the state and federal level, the highly-anticipated Sage Transparency 2.0 contributes to a future where healthcare pricing operates similarly to other industries, allowing consumers to easily compare prices and quality of care.
As was the case with the original version of the tool, Sage 2.0 allows users to analyze the latest price and quality data from various sources, such as RAND, the National Academy for State Health Policy (NASHP), Centers for Medicare & Medicaid Services (CMS), January Advisors, Quantros and others. In addition, there are two new tabs to offer consumers insight into medication pricing and legislator jurisdiction areas. By positioning easy-to-understand price data next to newly available patient experience and readmission penalty data, Sage 2.0 seeks to empower consumers, employers, and legislators to make informed healthcare decisions.
Key updates in Sage 2.0 include:
- Legislator Tab: Allows users to view healthcare data relevant to specific legislators.
- Hospital Comparison: Users can compare hospitals based on pricing (commercial payer mix, breakeven cost, operating profit margin, etc.), new quality ratings (Hospital Star Rating, Patient Experience Star Rating and Hospital Readmission Reduction Program Penalty) and additional metrics.
- Health System Comparison: Similar to hospital comparison but at the health system level.
- State Comparison: Allows users to compare healthcare data across different states.
- Medication Pricing: Provides insights into the pricing of physician-administered medications.
Using Sage 2.0 to Dig Deeper into Quality Ratings
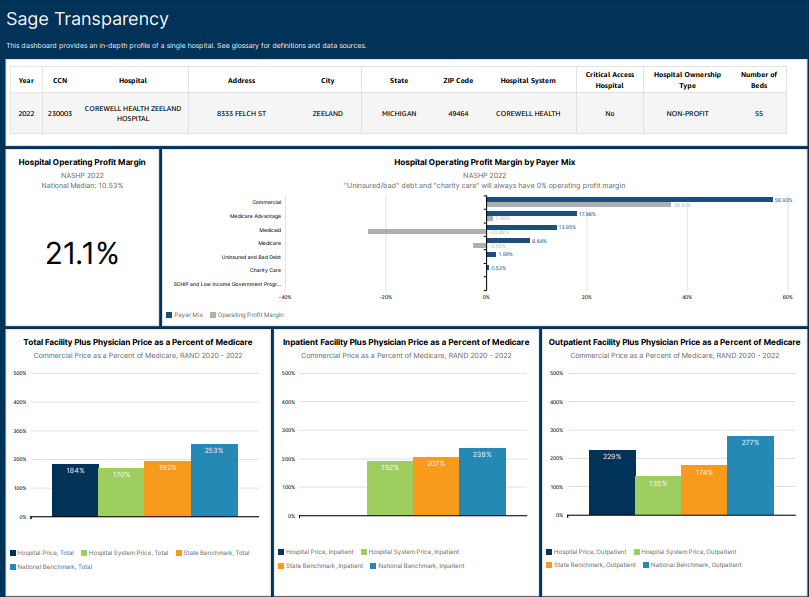
Using data from CMS, Sage Transparency 2.0 shows a hospital’s quality ratings over time to reveal trends that are useful to a consumer’s data-driven decision-making process. In the graph below, Sage 2.0 provides three years’ worth of data in 12 data points to help consumers answer the question, “Is my local healthcare quality improving, getting worse, or staying about the same?”
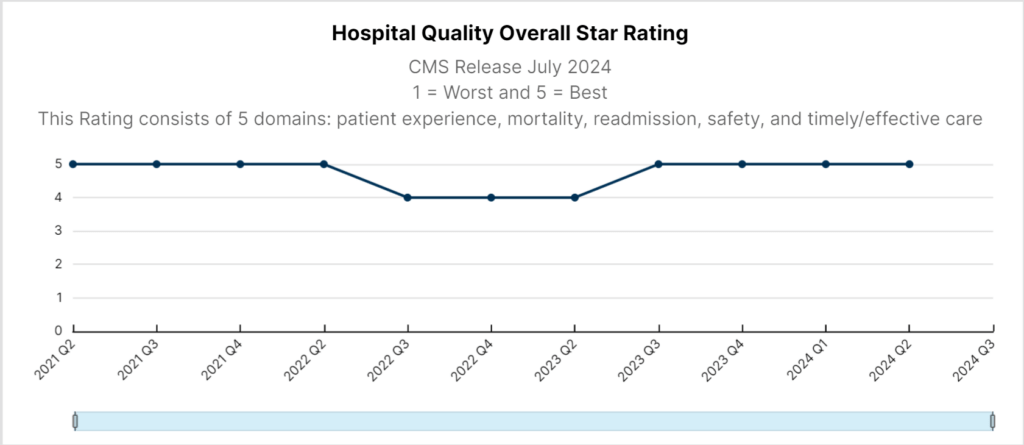
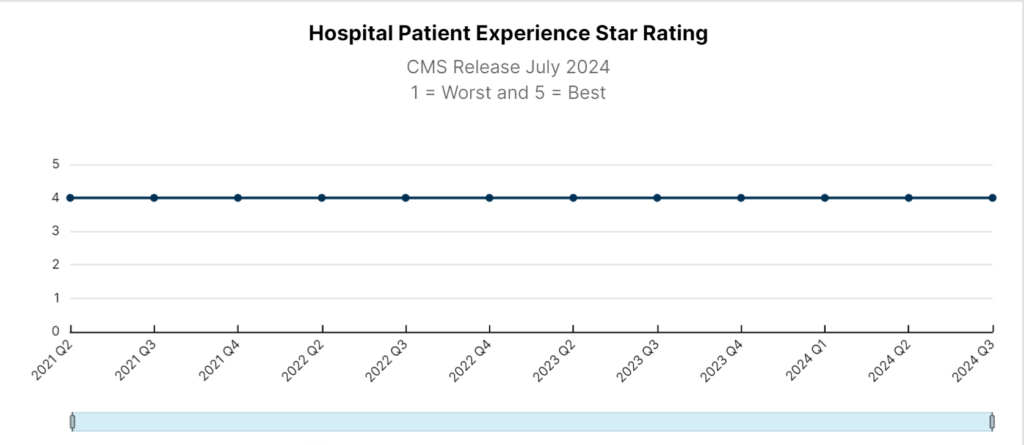
In our example, Corewell Health Zeeland Hospital was rated somewhere between a 4/5 and 5/5 in the CMS Hospital Quality Overall Star Rating from 2021 Q2 to 2024 Q2. In the corresponding graph, the Hospital Patient Experience Star Rating communicates a consistent 4/5 rating over the three-year reporting period, sharing a strong trend of adequate patient experience at this particular hospital.
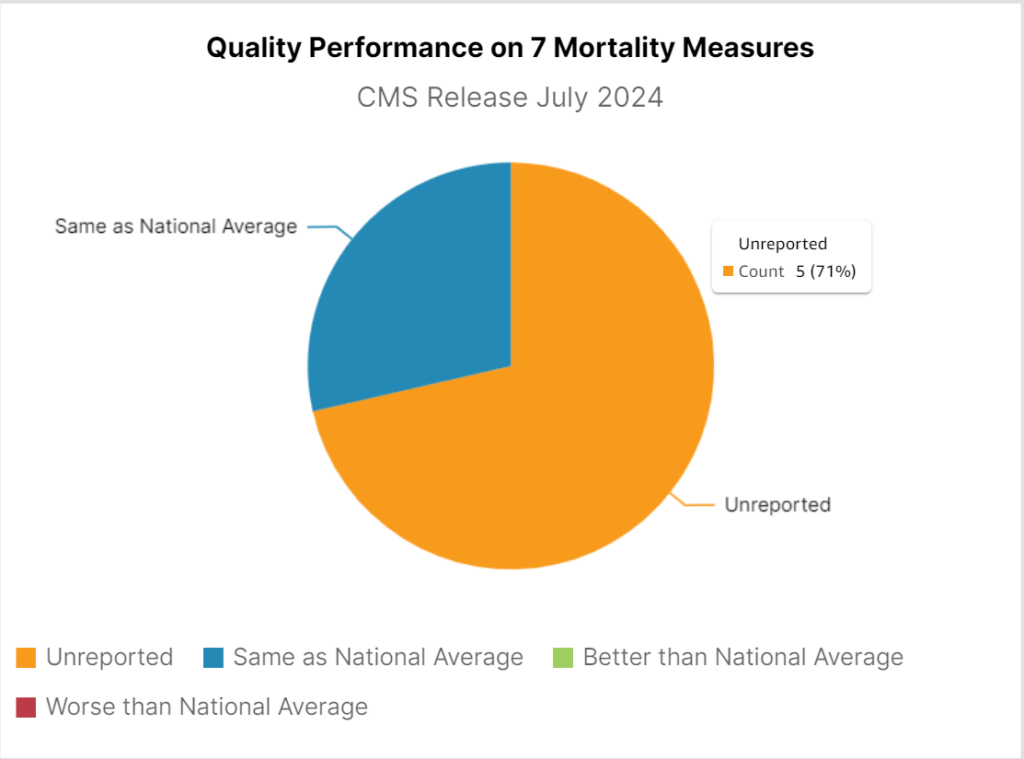
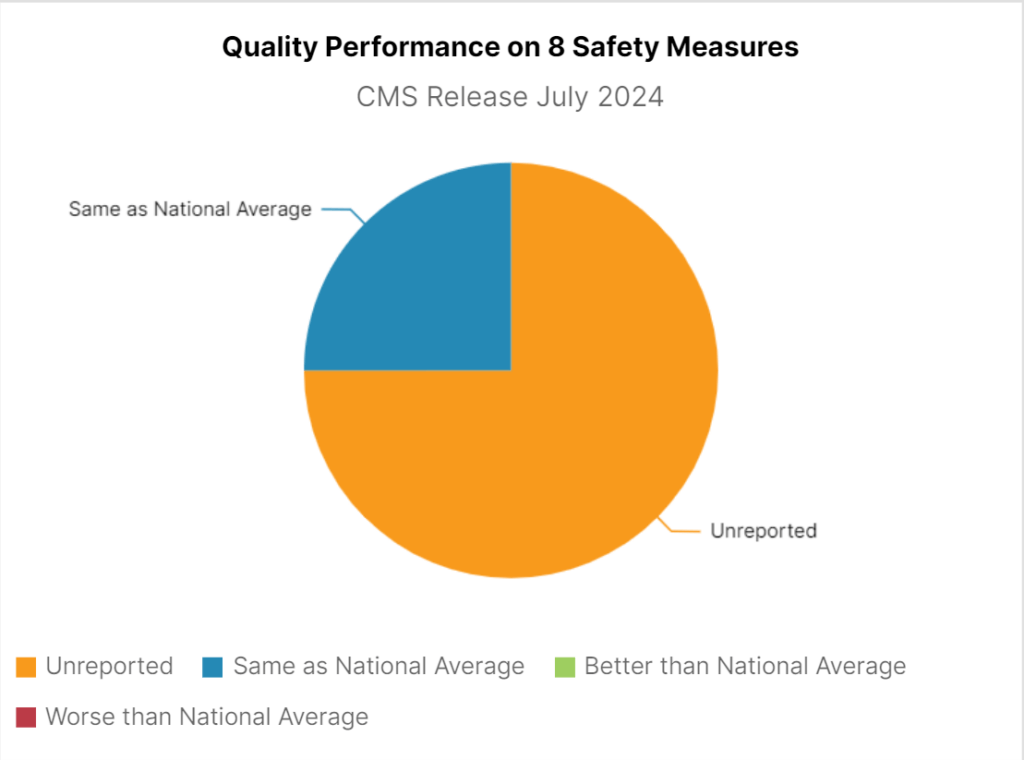
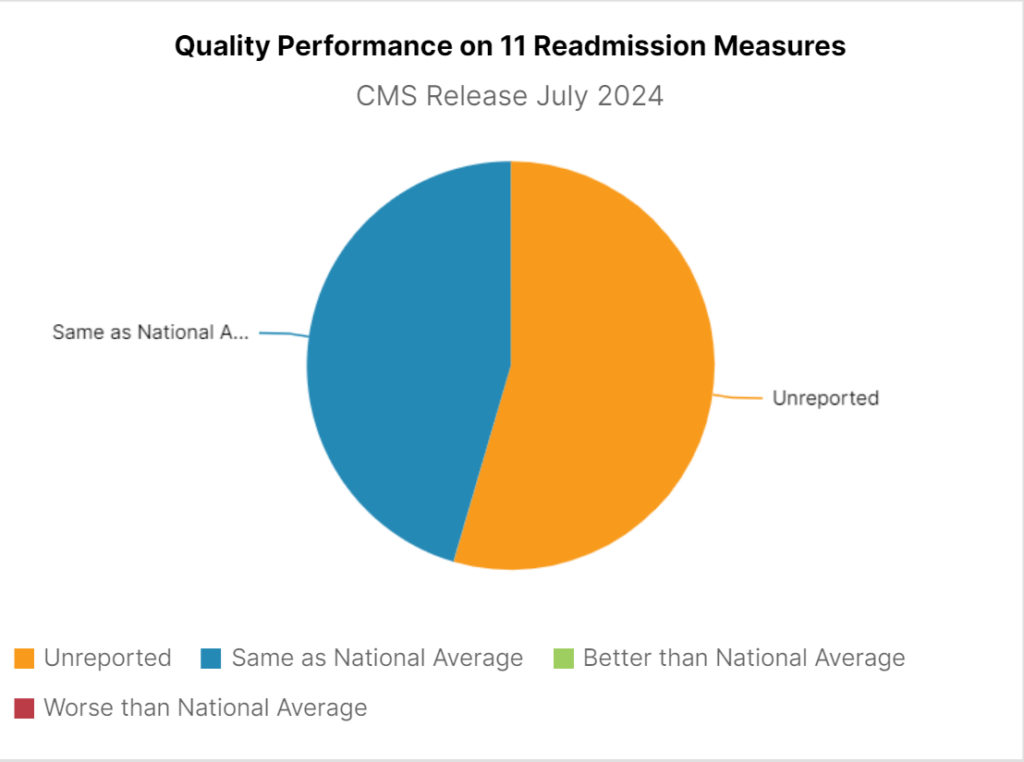
Looking at the same Michigan hospital, we can compare the quality of performance in mortality, safety and readmission against national averages. From this example, we can infer that this hospital’s quality performance in these three key areas is somewhat consistent with the national average, however, the majority of the data on mortality and readmission measures are unreported.
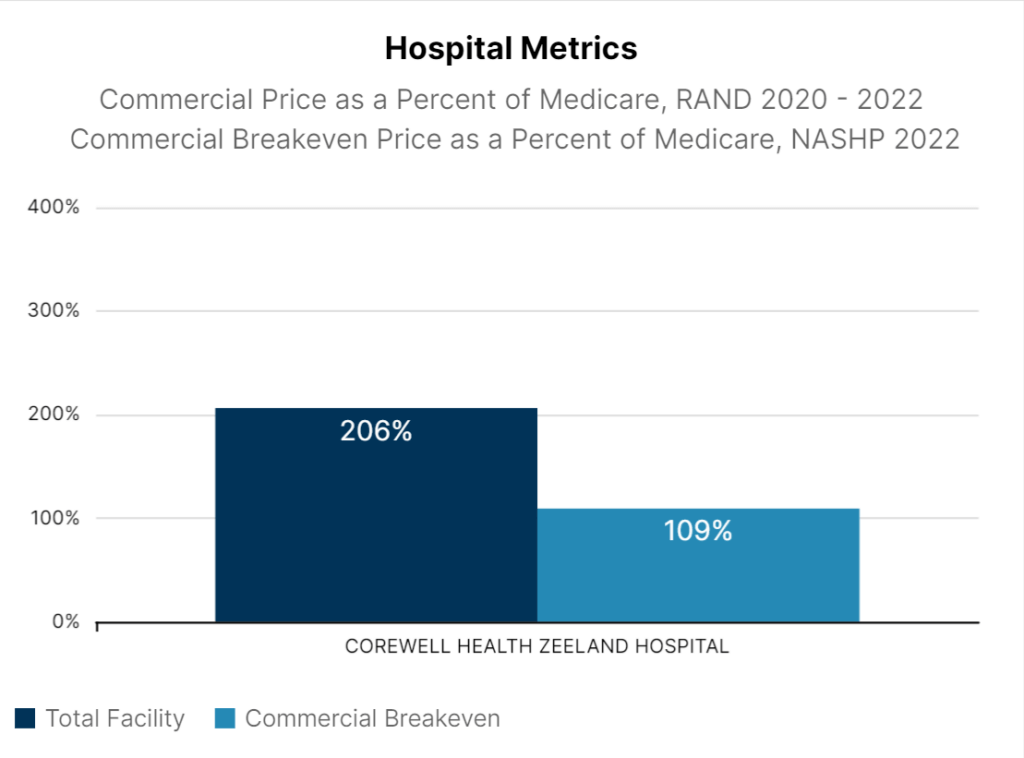
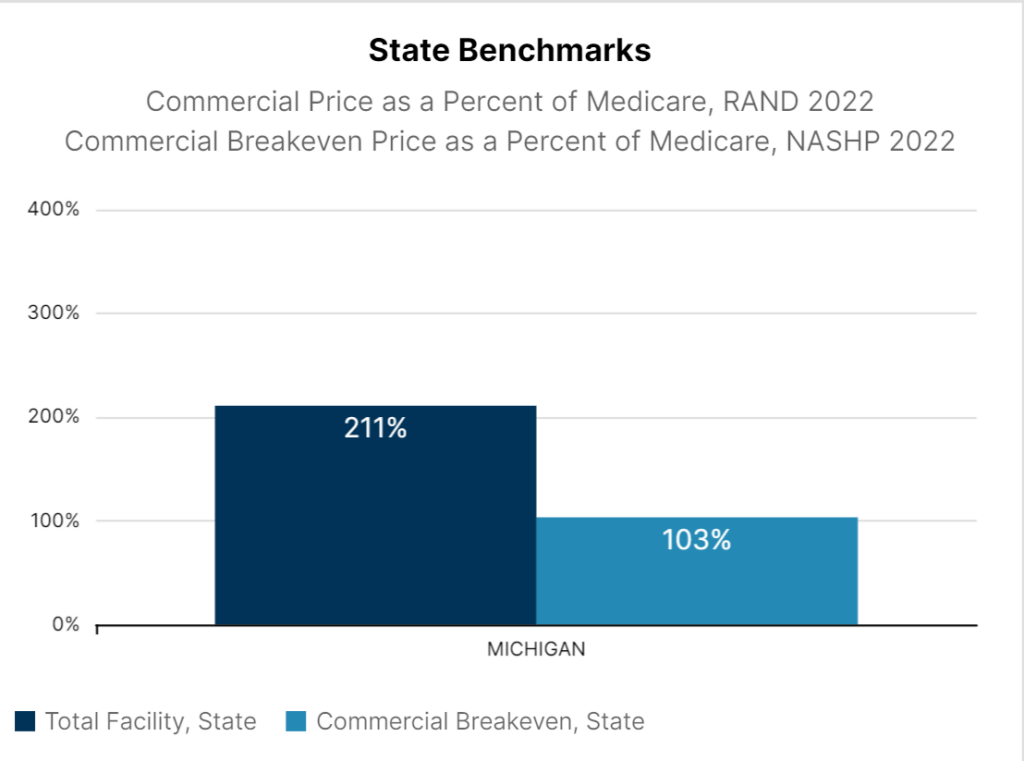
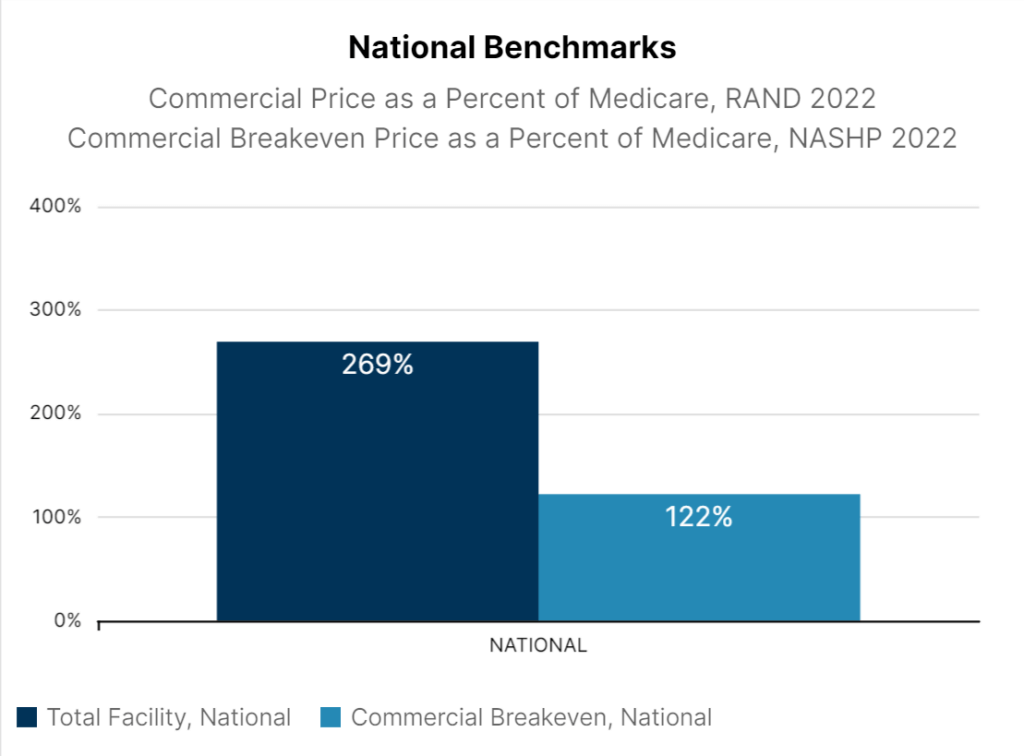
Just as was true in the original version, Sage 2.0 displays the national and state average breakeven prices to illustrate the cost-effectiveness of a hospital or system. For instance, our example shows that the average hospital in Michigan charges 211% of Medicare. Corewell Health Zeeland Hospital, on average, charges 206% of Medicare, indicating that this hospital is a little more affordable than state averages. Compared to the national average, which charges 269% of Medicare for total costs, this Michigan hospital is less expensive than many other health systems in the country.
By directly comparing robust quality information with relevant price data, users can start to shop for value when making decisions about their healthcare. As employers, if we design health benefits to be oriented around value, employees and employers alike have the opportunity to save money and experience more innovative benefit plans.
Leverage Knowledge for Lower Cost of Care
Sage Transparency 2.0 enables informed decision-making that can lead to cost savings and better healthcare outcomes for all stakeholders. Using this always-improving tool, employers can assess the margin between a hospital’s cost and price and then negotiate for fair reimbursement levels within that range. With this valuable information available freely at our fingertips, consumers can feel empowered to become auditors of healthcare coverage.
Access to high-quality care at competitive prices can substantially transform the future of healthcare to better serve consumers, ensuring thousands of dollars go back into businesses and their employees’ paychecks.
Interested in learning more about unique solutions to protect the affordability of your health plan? Contact us today to chat with one of our team members about your options!